Steady State Synchronous Response Results
Bode Plot
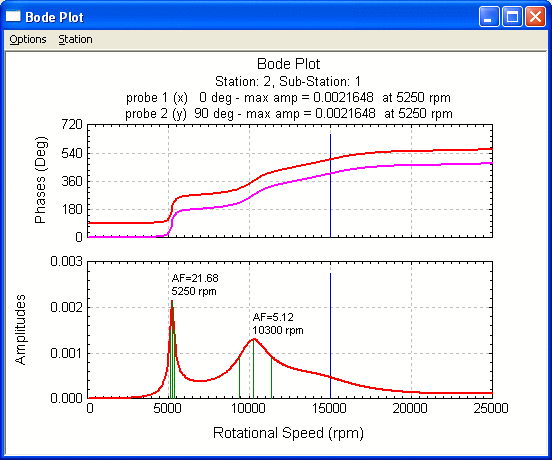
A Bode plot is a linear plot of amplitude and phase vs. shaft rotational speeds. You can change the graph title, labels, scale, number of divisions, probes angles and many others by changing the default settings in the Setting dialog under Options menu. Relative displacement can be specified in the Setting.

The Bode plot displays the response amplitude and phase at a specified finite element station due to the synchronous excitation (unbalance, shaft bow, disk skew). In the above figure, the amplitude and phase are shown for both the x and y directions. The amplitudes of motion are slightly different due to the effects of asymmetric bearing properties. Thus, the observed critical speeds and vibration amplitude may be different as observed from the x or y probes.
Amplification Factor
The program can allow you to label the Amplification Factors. The Amplification Factor (AF) is defined based on API Standards, such as API 611 for steam turbines or API 672 for geared compressors. The Amplification factor (AF) is defined as:

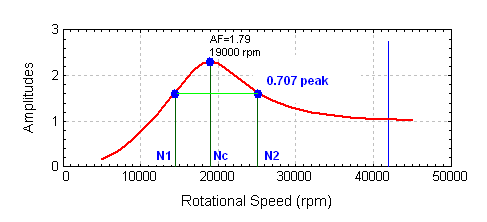
As stated in API Standards, When the rotor amplification factor, as measured at the vibration probe, is greater than or equal to 2.5, that frequency is called critical, and the corresponding shaft rotational frequency is called a critical speed. A critically damped system is one in which the amplification factor is less than 2.5.
Polar Plot
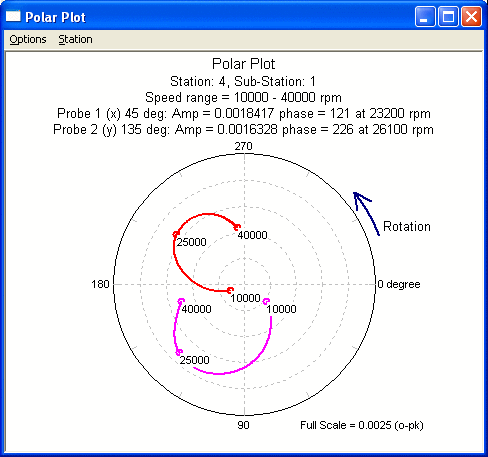
Polar Plot shows amplitude and phase in the polar coordinates over a speed range for a given finite element station. The shaft rotational direction is counterclockwise. You can change the graph title, labels, scale, number of divisions, probes angles and many others by changing the default settings in the Setting dialog under Options menu.
Elliptical Orbit Axes Plot
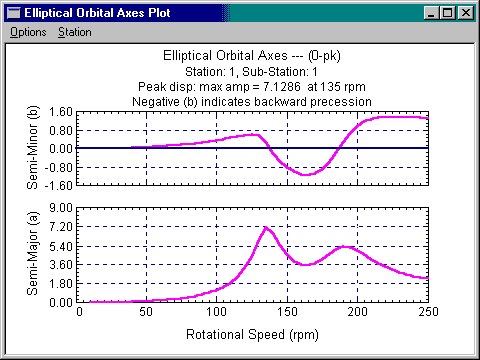
The Elliptical Orbit Axes Plot is a linear plot of semi-major axis amplitudes and semi-minor axis amplitudes vs. shaft rotational speeds. Positive semi-minor axis indicates the Forward Precession orbit. Negative semi-minor axis indicates the Backward Precession orbit.
The following figure is for a rotor system with asymmetric bearings. It shows that there are two distinct critical speeds split by bearing asymmetry in this example. Since the amplitudes of semi-major and semi-minor axes are different, the orbits are elliptical. When the rotor speed is either below the first critical speed or above the second critical speed, the rotor is in a state of forward synchronous whirl. There are backward precessions when the rotor is rotating with a speed between two critical speeds. Again, the presence of dampings and bearing cross-coupling stiffness, the backward precession may not exist.
Responses at Multiple Stations
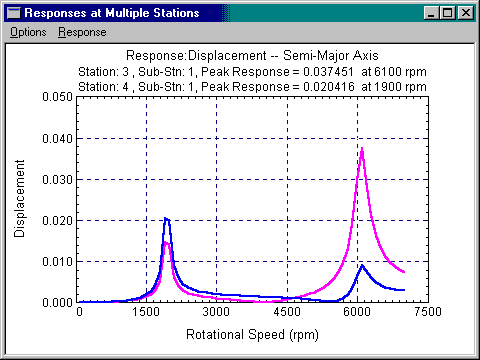
This option allows you to display the steady state synchronous response at multiple stations (up to 5 stations) simultaneously in order to compare the response along the rotor. You have the choice of plotting the displacement, velocity, or acceleration for the semi-major axis, the x motion, or the y motion. The response at multiple stations along the shaft is important from the standpoint of the positioning of monitoring probes or non-contact probes along the rotor to detect critical speeds. For example, a probe at the center of a rotor may observe the rotor first critical speed, but not the second; whereas a probe placed near the rotor end at a bearing may not see much amplitude at the first critical speed, but would detect the monitor at the second critical speed. You can change the graph title, labels, scale, number of divisions and many others by changing the default settings in the Setting dialog under Options menu.
Shaft Response 3D Animation
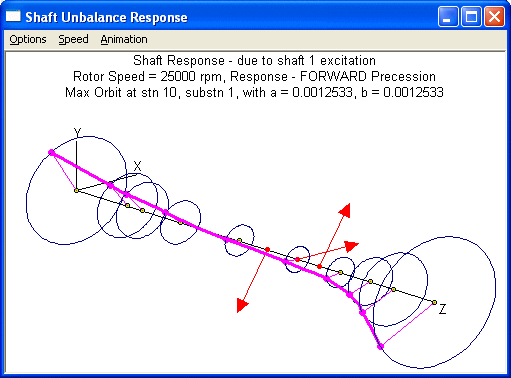
The option displays the steady state shaft response at a specified speed and/or startup/shutdown animation. This plot would be equivalent to taking an instantaneous strobe flash of the rotor and freezing it in time. At each station, the dots will move around the orbit with synchronous motion and will maintain their relative phase of motion with respect to each other. This orbital motion follows an elliptical path at each station. For symmetric bearing coefficients (isotropic system), the motion at each station reduces to circular. It is also apparent from the observation of the timing marks at each station that the response shape frozen in time is in the same plane. Note that a vibration probe placed at the station 3 would show little vibration regardless of the magnitude of unbalance. Animation option allows you to animate the motion at a single speed or during startup/shutdown.
Displacement Orbit at Specified Speed and Station
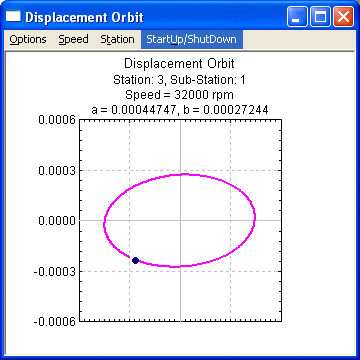
The Displacement Orbit Plot displays the response displacement at a specified speed and station. (a) is semi-major axis, (b) is semi-minor axis. You can change the graph title, labels, scale, number of divisions and many others by changing the default settings in the Setting dialog under Options menu. Animation option allows you to animate the motion during startup/shutdown.
Bearing/Support Transmitted Forces
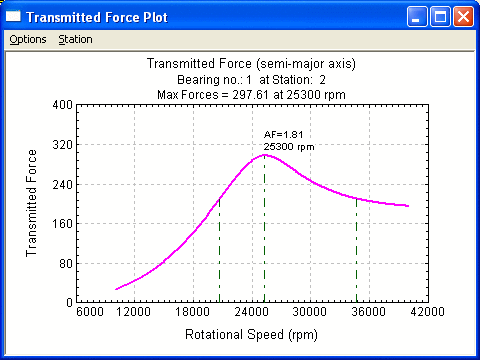
This plot displays the support transmitted forces vs. shaft rotational speeds. The transmitted bearing force can be an important design parameter. It should be noted that operation away from the critical speed can still result in large bearing forces transmitted.
Element Shear Forces and Moments
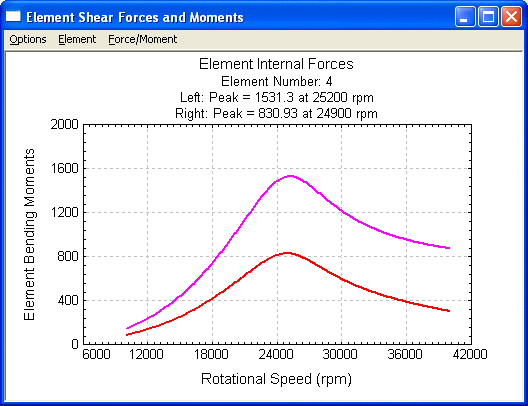
The option displays the element internal shear forces and moments due to steady state excitations. Shear forces are the default setting. You can display the moments by selecting Moments in the Force/Moment menu. You can also change the graph title, labels, scale, number of divisions and many others by changing the default settings in the Setting dialog under Options menu.
See also Lateral Vibration Analysis, Steady State Synchronous Response Analysis – Linear System, Steady State Synchronous Response Analysis – NonLinear System .
Copyright © 2014-2017